MANA Market Dynamics & Time-Series Forecasting
Bachelor Thesis · ARIMA · GARCH · Time Series
The Question
How can traditional economic and quantitative methods be applied to a digital economy and what risks emerge when financial activity moves into virtual environments?
Virtual Economy
A market inside a market
Using Decentraland and its native cryptocurrency, MANA, as a case study for the mechanics of an emerging digital economy.
01
Digital & Virtual Currencies
How value is issued and held inside a platform that isn't a bank.
02
Virtual Marketplaces
Where digital assets are listed, priced and traded.
03
Supply & Demand
The same forces, applied to a fixed-supply virtual land and token.
04
Digital Assets
MANA and the parcels of virtual land it's used to buy.
05
User Behaviour
How participants actually act inside a virtual economy, not just how they're modelled to.
06
Game-Theory Applications
The incentives participants respond to when the rules are written in code.
Virtual Asset Risk
Qualitative contextFinancial Cybercrime & Fraud-Related Risks
Qualitative research context from the thesis, distinct from the quantitative ARIMA/GARCH forecasting work elsewhere in this project, and not a dedicated fraud-detection or AML transaction-monitoring system.
Case Note
Alongside the quantitative analysis, the thesis also examined financial cybercrime and illicit activity in virtual economies.
RISK_01
Crypto Theft
Unauthorized theft of cryptocurrency from exchanges or digital environments.
RISK_02
Fake NFT Activity
Trading of fake NFTs and deceptive virtual assets.
RISK_03
Black-Market Transactions
Transactions taking place outside platform rules, including activity designed to avoid fees or taxes.
RISK_04
Monitoring & Regulation
The need for stronger monitoring, user protection and regulatory oversight in emerging virtual economies.
Red Flag
Virtual economies create new opportunities for financial activity, but they also introduce new forms of financial cybercrime and fraud-related risk that require monitoring, controls and regulatory attention.
the same environment that makes forecasting hard also makes oversight hard
Thesis Research · Financial Cybercrime in Virtual Economies
Time Series
Reading MANA as a financial series
Brief_01
Data
Brief_02
Trend
Brief_03
Seasonality
Brief_04
Stationarity
MANA price evolution
Exhibit A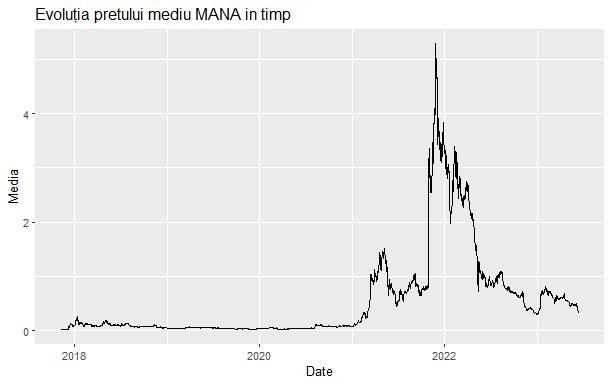
Historical MANA Price
Historical MANA-USD price evolution used for the time-series analysis.
Source: Thesis analysis · R
Trend test
Exhibit B
Trend Regression
Linear regression of the series against time, used to test for a deterministic trend.
Source: Thesis analysis · R
Trend / seasonality
Exhibit C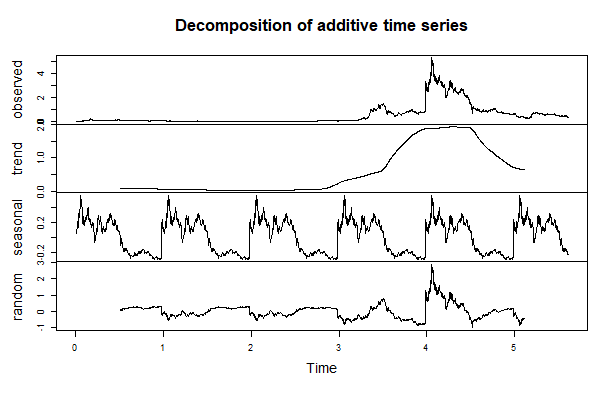
Seasonal Decomposition
Observed series decomposed into trend, seasonal and random components.
Source: Thesis analysis · R
Forecasting Model
Building the ARIMA model
Autocorrelation was read from the series' ACF / PACF profile, then an ARIMA(2,0,2) model was fitted to forecast MANA's price evolution.
First-order differencing was performed during preprocessing — confirmed stationary by the Augmented Dickey-Fuller test (Dickey-Fuller = −11.39, p ≈ 0.01) — and ARIMA was fitted to that already-differenced series with d = 0. Manual differencing followed by ARIMA(2,0,2) is therefore conceptually equivalent to an integrated ARIMA(2,1,2) on the original price level.
ACF
Exhibit D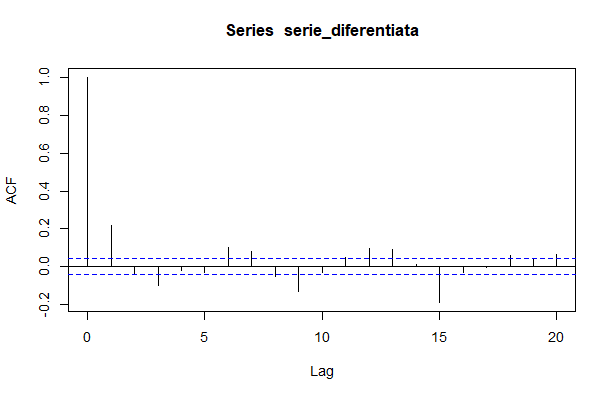
Autocorrelation
Autocorrelation function of the differenced MANA series.
Source: Thesis analysis · R
PACF
Exhibit E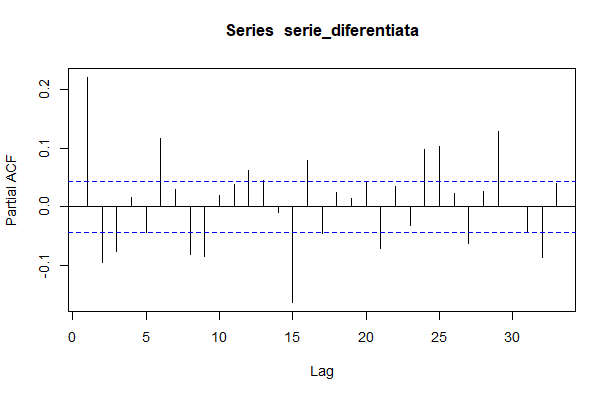
Partial Autocorrelation
Partial autocorrelation used to help identify the ARIMA order.
Source: Thesis analysis · R
Fitted model
Exhibit F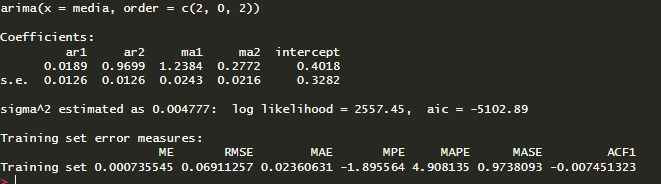
ARIMA(2,0,2)
Coefficient estimates for the fitted ARIMA(2,0,2) model.
Source: Thesis analysis · R
ARIMA forecast
Exhibit G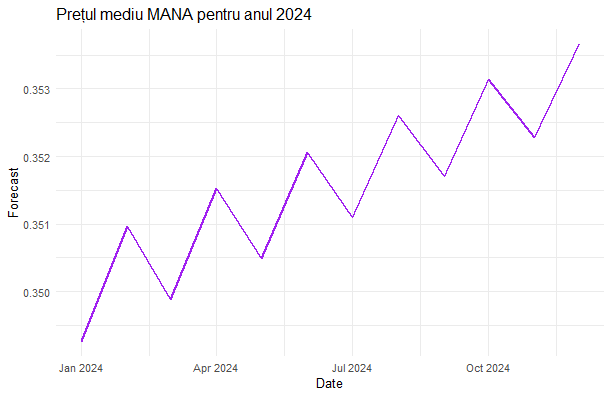
2024 Forecast
ARIMA(2,0,2) forecast of MANA's average price for 2024.
Source: Thesis analysis · R
Model Diagnostics
Where the model started to strain
The ARIMA model wasn't taken at face value. Its residuals were checked against their own assumptions.
- Shapiro-Wilk
- Normality of the ARIMA residuals
- Ljung-Box
- Autocorrelation left in the residuals
- Breusch-Pagan
- Heteroscedasticity: non-constant residual variance
Finding
The Breusch-Pagan test revealed heteroscedasticity in the residuals: a limitation of the ARIMA model that motivated the next step.
Reasoning chain
Future validation step
A dedicated Engle ARCH-LM test on the ARIMA residuals would give a sharper, standard statistical justification for GARCH than Breusch-Pagan alone. It has not yet been computed for this project — the Breusch-Pagan result above is the actual evidence used to motivate the volatility model.
Volatility Analysis
Modelling the risk ARIMA couldn't see
A GARCH model was added specifically to analyse and forecast that changing volatility, reading risk, not just price.
ARIMA models
The conditional mean — temporal dependence in the price level itself.
GARCH models
The conditional variance — volatility clustering left in the residual process, not the price prediction itself.
Analytical flow
Returns series
Exhibit H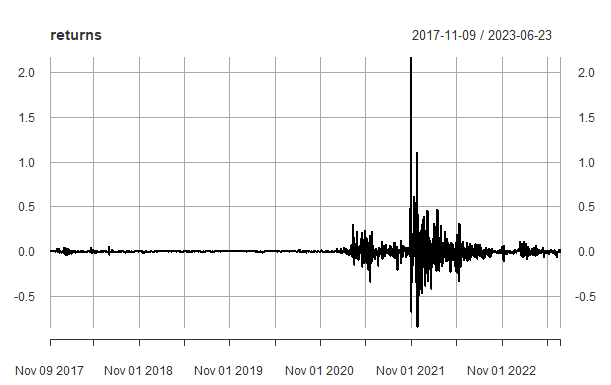
Volatility Clustering
MANA's return series, showing the volatility clustering an ARIMA model can't capture.
Source: Thesis analysis · R
GARCH diagnostics
Exhibit I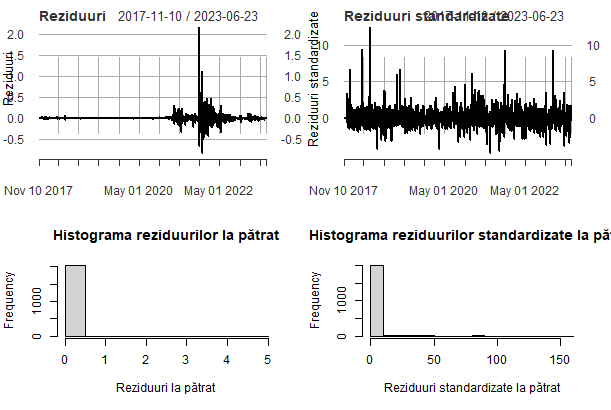
Residual Diagnostics
Standardised GARCH residuals and their distribution, used to validate the volatility model.
Source: Thesis analysis · R
Retrospective Forecast Validation
Backtest pending historical-data integrationDid the forecast actually hold?
The original ARIMA(2,0,2) forecast projected MANA's average price for 2024 — a period that has now already occurred. A proper backtest compares that forecast against the actual observed values, not just reports the forecast on its own.
Planned comparison
Planned metrics
- MAE
- Pending
- RMSE
- Pending
- Naive baseline · next value = previous observed value
- Pending
Backtest pending historical-data integration
Actual 2024 MANA price observations are not currently stored in this project. This section documents the intended validation methodology — including a comparison against a simple naive baseline and, where the price scale makes it stable, MAPE — rather than reporting metrics that haven't actually been calculated.
Limitations
This was a bachelor-thesis-style academic exercise, not a production trading system. Cryptocurrency prices are highly volatile and prone to structural breaks; the series' stationarity and the ARIMA/GARCH parameters were estimated over one specific historical window, and a relationship that held in the past is no guarantee of future behaviour. The model's predictive horizon should be read accordingly as limited.
Key Finding
This project combined economic research, financial data analysis, forecasting, statistical testing, model validation and risk analysis, not just a cryptocurrency price prediction.
Analytical Workflow
How the two threads connect
Quantitative forecasting and financial-crime risk research approached the same emerging economy from two different angles, one modelling its price behaviour, the other its exposure.
the model that failed said the most
Tools & Methods
What went into it
forecast the level, model the risk, question the oversight
Case 003 · Quantitative Research
Back to all cases→